Find
lake
Click the Find lake button and a field will appear in which you can write the lake's name or a part of it. Click the Submit button and all the lakes that correspond to your search will be listed. Select the right lake by clicking Select from the end of the row. After this, you will get all the basic information about the lake automatically into the data form. If your lake is not on the list, return to the data form and fill in all the basic information yourself.
First try if your lake can be found from the LLR-database (the Find lake button) If not, fill in lake name and all the other basic information.
Volume
Mean depth
The number that equals your lake's type. From the table
below you can see the Finnish lake types and their characteristics.
|
Finnish lake types (A = area, z = mean
depth) |
|||
|
Type |
Code |
Name of the type |
Characteristics |
|
1 |
Vh |
Small and medium low humic lakes |
A < 4,000 ha; color < 30 mg Pt/l; z ≥ 3 m |
|
2 |
Ph |
Small humic lakes |
A < 500 ha; color: 30-90 mg Pt/l; z ≥ 3 m |
|
3 |
Kh |
Medium humic
lakes |
A: 50 - 4,000 ha; color: 30-90 mg Pt/l; z ≥ 3 m |
|
4 |
SVh |
Large low humic lakes |
A > 4,000 ha, color < 30 mg Pt/l |
|
5 |
Sh |
Large humic lakes |
A > 4,000 ha; color ≥ 30 mg Pt/l |
|
6 |
Rh |
Very humic lakes |
color > 90 mg Pt/l, z ≥ 3 m |
|
7 |
MVh |
Shallow low humic lakes |
color < 30 mg Pt/l, z < 3 m |
|
8 |
Mh |
Shallow humic lakes |
color: 30-90 mg Pt/l, z < 3 m |
|
9 |
MRh |
Shallow very humic lakes |
color > 90 mg Pt/l, z < 3 m |
|
10 |
Lv |
Lakes with a very short retention time |
Retention time about 10 days or less |
|
11 |
PoLA |
Lakes in
northern Lapland |
Located above the tree line (of pine) |
|
12 |
RrRk |
Nutrient rich and very calciferous lakes (subtype not defined) |
Naturally rich in nutrients or lime |
|
13 |
Rr |
Nutrien rich lakes (subtype of RrRk) |
Catchment naturally rich in nutrients |
|
14 |
Rk |
Very calciferous lakes (subtype of RrRk) |
High lime
content |
|
(Source: Finnish Environment Institute. Instructions for determining the type of the surface water 15.1.2007 (in Finnish).) |
|||
Data chart
Create an Excel chart and label the columns A-E exactly as in the example below. Make sure you have all the small and capital letters right! Save the chart in csv-format.
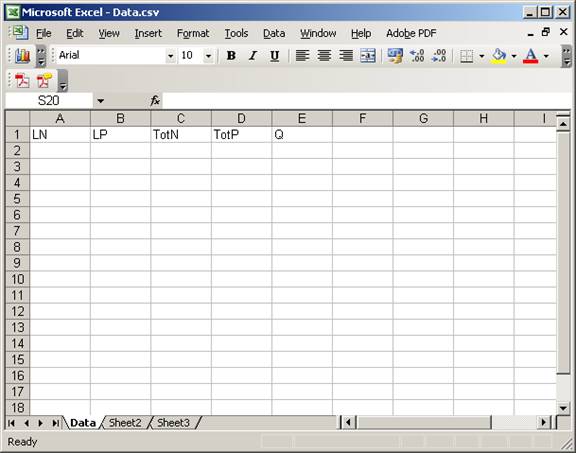
To fill in the chart you need the following data about the lake as averages over the lakes retention time:
LN total nitrogen load (kg/d)
LP total phosphorus load (kg/d)
TotN total nitrogen concentration
(µg/l)
TotP total phosphorus concentration
(µg/l)
Q outflow (m3/s).
Make sure you have the values in the right units! Try to collect data from as long a time period, and from as many retention periods as possible. You should have data from at least two retention periods, giving a minimum of two rows. If you have loading and concentration values for only one of the other nutrient, you can leave those columns empty and use the option Target load based on good/mod class boundary of TotP or Target load based on good/mod class boundary of TotN for target load estimates.
The retention time used here is the lake's actual retention time rounded up to the next whole year (so the minimum retention time will be one year). Retention time (in days) can be calculated with the equation
![]()
where
T = retention time (d)
V = volume (m3)
Q = outflow (m3/s)
The load values (LN and
LP) are the average daily loads, calculated from the estimated or measured sum
loads for the retention time.
The total nitrogen and
total phosphorus concentrations (TotN and TotP) are averages for the retention
time, but only the values from the growing season (or seasons, if the retention
time is longer than one year) are taken into account when calculating the
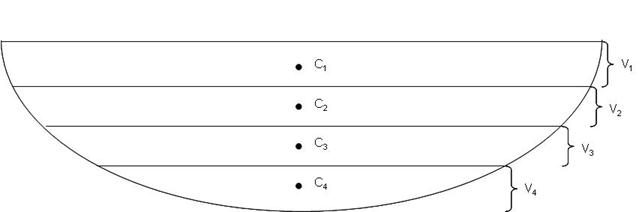
average. If there are concentration values from different parts of the lake, use
the ones from the main basin. If samples are also taken from different depths
of the basin, calculate first the volume weighted average (if possible) for
every sampling occasion with the equation
![]()
where
CTot total nutrient concentration
(µg/l)
Cn the nutrient concentration of the
water layer n (µg/l)
Vn the
volume of the water layer n (from the midpoint of the observation Cn
and it's upper observation to the midpoint of the observation Cn and
it's lower observation, see figure below.)
(m3)
V total volume of the lake (m3)
If the sampling interval
is longer than the lake's retention time (in years), you can use the values
from each sampling occasion as they are. However, carefully consider how representative
the values are, as there can be big variation in in-lake concentrations during
the growing season.
When you have the data chart ready, click the Browse button, search for the chart file in your directory and choose Open.
If you do not have enough data for the data chart, click the I don't have data button and continue to fill in the new data form that appears.
Loading/Flush
If you do not have the data needed for the Data chart, give an estimate of the daily phosphorus and nitrogen load (kilograms per day) and of the lakes outflow (cubic meters per second).
Color
Prediction
probability (fixed)
When the prediction probability is 50, there is a 50 % possibility to achieve good water quality with the target loads given by the models. Nevertheless, the possibility of failure is also 50 %. This probability level is always used in all the predictions.
Prediction probability 2
You can make the estimates of the lake specific model more accurate by choosing higher probability levels. For instance with prediction probability 80, the possibility to achieve good water quality is 80 % and the possibility of failure only 20 % (see also Prediction probability (fixed)). You can examine what effect a higher prediction probability has on the target load estimations.
Prediction probability 3
As Prediction probability 2. You can add one more probability level and compare the target load estimations.
Chl-a and nutrient data
If your lake can be found in the LLR-database (see Find lake), the chlorophyll-a and nutrient data needed to run the chlorophyll-a model is also ready. If not, create an Excel chart exactly like in the example below and save it in csv-format. Make sure you label the colums A-C right!
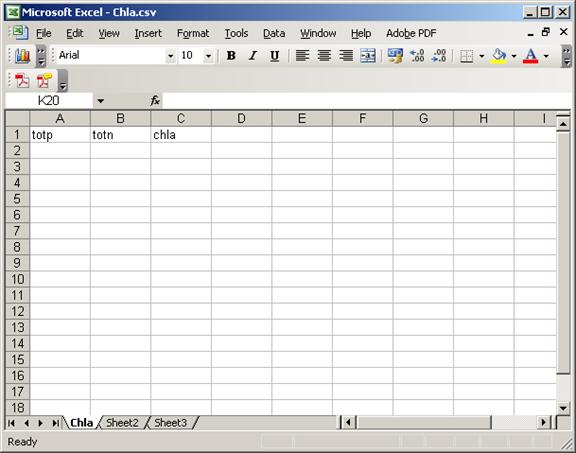
totp = total phosphorus
concentration (µg/l)
totn = total nitrogen
concentration (µg/l)
chla = chlorophyll-a concentration (µg/l)
To fill in the chart you need surface water concentration values of total phosphorus, total nitrogen and chlorophyll-a from all the sampling occasions that have taken place during the growing season in different years. No averages need to be calculated. If there are concentration values from different parts of the lake, use the ones from the main basin.
When you have the data chart ready, click the Browse button, search thechart file from your directory and choose Open
Target load based on good/mod class boundary of TotP
With this option LLR gives you an estimate of the target phosphorus
load with which the in-lake phosphorus concentration reaches the good/moderate
class boundary.
Target load based on good/mod class boundary of TotN
With this option LLR gives you an estimate of the target nitrogen load with which the in-lake nitrogen concentration reaches the good/moderate class boundary.
Target loads based on good/mod class
boundary of TotP and TotN
With this option LLR gives you an estimate of the target phosphorus
and nitrogen load with which the in-lake phosphorus and nitrogen concentration reaches
the good/moderate class boundary.
Target loads based on good/mod class
boundary of Chl-a
With this option LLR gives you an estimate of the target phosphorus and nitrogen load with which the in-lake chlorophyll-a concentration reaches the good/moderate class boundary.
Target loads based on good/mod class boundary of phytoplankton biomass
In this option LLR gives you an estimate of the target phosphorus and nitrogen load with which the phytoplankton biomass will not exceed the good/moderate class boundary.
Water quality class boundaries
|
Water quality class boundaries for Finnish lakes |
|||||||||
|
Type |
Variable |
Class boundaries |
|||||||
|
|
|
|
High/Good |
Good/Mod |
Mod/Poor |
Poor/Bad |
|||
|
1. Vh |
TotP |
µg/l |
10 |
18 |
35 |
70 |
|||
|
|
TotN |
µg/l |
400 |
500 |
750 |
1000 |
|||
|
|
Chl-a |
µg/l |
4 |
7 |
14 |
28 |
|||
|
|
Biomass |
mg/l |
0,6 |
1,3 |
2,6 |
5,2 |
|||
|
2. Ph |
TotP |
µg/l |
18 |
28 |
45 |
90 |
|||
|
|
TotN |
µg/l |
510 |
700 |
1000 |
1500 |
|||
|
|
Chl-a |
µg/l |
7 |
15 |
24 |
48 |
|||
|
|
Biomass |
mg/l |
1,5 |
3,8 |
7,6 |
14 |
|||
|
3. Kh |
TotP |
µg/l |
18 |
28 |
45 |
90 |
|||
|
|
TotN |
µg/l |
540 |
660 |
1000 |
1500 |
|||
|
|
Chl-a |
µg/l |
7 |
12 |
24 |
48 |
|||
|
|
Biomass |
mg/l |
1,2 |
3,3 |
6,6 |
13 |
|||
|
4. SVh |
TotP |
µg/l |
10 |
18 |
35 |
70 |
|||
|
|
TotN |
µg/l |
400 |
500 |
700 |
900 |
|||
|
|
Chl-a |
µg/l |
3,6 |
7 |
13 |
26 |
|||
|
|
Biomass |
mg/l |
0,5 |
0,9 |
1,9 |
3,8 |
|||
|
5. Sh |
TotP |
µg/l |
15 |
25 |
40 |
80 |
|||
|
|
TotN |
µg/l |
460 |
600 |
900 |
1300 |
|||
|
|
Chl-a |
µg/l |
6 |
11 |
20 |
40 |
|||
|
|
Biomass |
mg/l |
0,9 |
1,7 |
3,4 |
6,7 |
|||
|
6. Rh |
TotP |
µg/l |
30 |
45 |
65 |
120 |
|||
|
|
TotN |
µg/l |
590 |
750 |
1100 |
1800 |
|||
|
|
Chl-a |
µg/l |
12 |
20 |
40 |
80 |
|||
|
|
Biomass |
mg/l |
1,3 |
2,4 |
4,8 |
9,6 |
|||
|
7. MVh |
TotP |
µg/l |
15 |
25 |
45 |
80 |
|||
|
|
TotN |
µg/l |
480 |
600 |
1000 |
1500 |
|||
|
|
Chl-a |
µg/l |
5 |
8 |
15 |
30 |
|||
|
|
Biomass |
mg/l |
1,2 |
2,3 |
4,6 |
9,2 |
|||
|
8. Mh |
TotP |
µg/l |
25 |
40 |
65 |
100 |
|||
|
|
TotN |
µg/l |
600 |
750 |
1100 |
1800 |
|||
|
|
Chl-a |
µg/l |
12 |
20 |
40 |
60 |
|||
|
|
Biomass |
mg/l |
1,6 |
4,4 |
8,8 |
17 |
|||
|
9. MRh |
TotP |
µg/l |
40 |
55 |
80 |
150 |
|||
|
|
TotN |
µg/l |
680 |
850 |
1400 |
2200 |
|||
|
|
Chl-a |
µg/l |
15 |
25 |
50 |
100 |
|||
|
|
Biomass |
mg/l |
2 |
5,4 |
10,6 |
21,2 |
|||
|
10. Lv |
TotP |
µg/l |
25 |
40 |
70 |
90 |
|||
|
|
TotN |
µg/l |
450 |
610 |
900 |
1400 |
|||
|
|
Chl-a |
µg/l |
5 |
8 |
20 |
35 |
|||
|
|
Biomass |
mg/l |
Class boundaries
not set |
||||||
|
11. PoLa |
TotP |
µg/l |
9 |
12 |
15 |
20 |
|||
|
|
TotN |
µg/l |
190 |
300 |
400 |
600 |
|||
|
|
Chl-a |
µg/l |
3 |
5 |
10 |
20 |
|||
|
|
Biomass |
mg/l |
Class boundaries
not set |
||||||
|
12. RrRk |
TotP |
µg/l |
40 |
55 |
75 |
120 |
|||
|
|
TotN |
µg/l |
780 |
930 |
1200 |
1800 |
|||
|
|
Chl-a |
µg/l |
12 |
20 |
40 |
60 |
|||
|
|
Biomass |
mg/l |
Class boundaries not set |
||||||
|
13. Rr |
TotP |
µg/l |
40 |
55 |
75 |
120 |
|||
|
|
TotN |
µg/l |
780 |
930 |
1200 |
1800 |
|||
|
(savialueet) |
Chl-a |
µg/l |
12 |
20 |
40 |
60 |
|||
|
(muut) |
Chl-a |
µg/l |
7 |
12 |
25 |
50 |
|||
|
|
Biomass |
mg/l |
Class boundaries
not set |
||||||
|
14. Rk |
TotP |
µg/l |
20 |
30 |
50 |
80 |
|||
|
|
TotN |
µg/l |
550 |
750 |
1100 |
1600 |
|||
|
(savialueet) |
Chl-a |
µg/l |
12 |
20 |
40 |
60 |
|||
|
(muut) |
Chl-a |
µg/l |
7 |
12 |
25 |
50 |
|||
|
|
Biomass |
mg/l |
Class boundaries not set |
||||||
|
TotP = total phosphorus concentration |
|
||||||||
|
TotN = total nitrogen concentration |
|
||||||||
|
Chl-a = chlorophyll-a concentration |
|
||||||||
|
Biomass = phytoplankton biomass in June-August |
|
||||||||
|
|
|
|
|
||||||
|
(Source: Finnish Environment Institute & Finnish Game and Fisheries Research Institute. |
|||||||||
|
Reference conditions for ecological classification of
surface waters and assessing the class. 22.1.2008 (in Finnish).) |
|||||||||